| Rail
Freight Transportation Today
 Today's
freight railroads are considered faster, safer, and more efficient than ever. The Association
of American Railroads (AAR) points out that the railroads together provide a cost effective system
that ties local businesses together into one national economy - from farmers and manufactures,
to e-commerce companies that need fast delivery. Over the past decades the railroad industry
has continued to invest in new tracks, modern locomotives, freight cars and new communication
systems to make the rail system "cleaner, greener and safer." Today's
freight railroads are considered faster, safer, and more efficient than ever. The Association
of American Railroads (AAR) points out that the railroads together provide a cost effective system
that ties local businesses together into one national economy - from farmers and manufactures,
to e-commerce companies that need fast delivery. Over the past decades the railroad industry
has continued to invest in new tracks, modern locomotives, freight cars and new communication
systems to make the rail system "cleaner, greener and safer."
According to the AAR, a total of 562 common carrier freight railroads were operating in the
United States at the end of 2005. These railroads employed approximately 187,000 workers, with
an average wage of $66,975 and total compensation of nearly $91,000.
Major Freight Railroad Companies:
Today railroad companies are classified by the U.S. Interstate Commerce Commission on the basis
of gross revenue. The largest are considered Class I Railroads. The Class I railroads account
for 68 percent of the mileage operated and 93 percent of freight revenue. The Class 1 railroads
primarily provide long-haul, high-density intercity transportation. This list includes:
The AAR also includes 30 regional railroads, which are linehaul railroads with
at least 350 route miles and/or revenue over $40 million; 320 local linehaul
carriers which operate less than 350 route miles and earn less than $40 million; and 203 switching
and terminal carriers that primarily provide switching and terminal services.
Two major Canadian Freight Railroads, Canadian
National Railway, and Canadian
Pacific Railway also have extensive operations in the United States.
Other Major North American Railroads include:
Type of Freight Carried by Class 1 Railroads for 2003 and 2005:
| Commodity Group |
2003 Tons Originated |
2003 Percent
of Total |
2005 Tons Originated |
2005 Percent
of Total |
| Coal |
784,042 |
43.6 |
804,139 |
42.4 |
| Chemicals & allied products |
163,018 |
9.1 |
167,199 |
8.8 |
| Farm products |
141,324 |
7.9 |
140,441 |
7.4 |
| Non-metalic minerals |
132,552 |
7.4 |
145,697 |
7.7 |
| Misc. mixed shipments* |
103,875 |
5.8 |
119,835 |
6.3 |
| Food & kindred products |
102,114 |
5.7 |
102,191 |
5.4 |
| Metals & products |
55,166 |
3.1 |
57,851 |
3.0 |
| Stone, clay & glass products |
51,046 |
2.8 |
55,231 |
2.9 |
| Petroleum & coke |
47,968 |
2.7 |
55,611 |
2.9 |
| Lumber & wood products |
47,466 |
2.6 |
47,603 |
2.5 |
| Waste & scrap materials |
41,497 |
2.3 |
47,345 |
2.5 |
| Pulp, paper & allied products |
38,543 |
2.1 |
38,242 |
2.0 |
| Motor vehicles & equipment |
34,314 |
1.9 |
35,585 |
1.9 |
| Metalic ores |
32,693 |
1.8 |
59,941 |
3.2 |
| All other commodities |
23,448 |
1.3 |
21,810 |
1.1 |
| Total |
1,799,066 |
100 |
1,898,721 |
100 |
* Miscellaneous mixed shipments (STCC 46) is mostly intermodal traffic.
Some intermodal traffic is also includedin commodity-specific categories.
STCC 46 accounts for about two thirds of intermodal tonnage. Source: Association
of Americal Railroads.
Class I Railroad Traffic:
| |
2002 |
2003 |
2004 |
2005 |
| Carloads Originated (million) |
27.90 |
28.87 |
30.09 |
31.14 |
| Intermodal Units (million)*: |
|
|
|
|
| Containers |
6.75 |
7.33 |
8.07 |
8.71 |
| Trailers |
2.40 |
2.63 |
2.93 |
2.98 |
| Total |
9.15 |
9.96 |
10.99 |
11.69 |
| Tons Originated (million) |
1,767 |
1,799 |
1,844 |
1,899 |
| Ton-miles (million) |
1,507,000 |
1,551,000 |
1,663,000 |
1,696,000 |
Source: Association of Americal Railroads.
* Includes 1 regional railroad and excludes Canadian-owned Class 1 railroads.
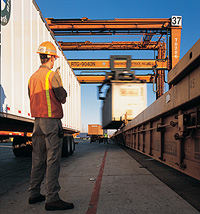
 Photo courtesy BNSF, text by Richard Boehle, freight and traffic information courtesy Association of American Railroads.
Entire website copyright 2002-2010, DigitalNetExpress.com, Burbank, California.
|